New national maps indicate where in the country groundwater nitrate contamination is unlikely to be an issue – even in areas that haven’t been specifically tested.
The maps, based on a modelling methodology developed and refined over the past decade, have been produced by scientists at Lincoln Agritech and ESR, and are available on the Data Supermarket developed by the National Science Challenge Our Land and Water.
Nitrate contamination is an issue in some areas but not others because of differences in the land use, but also because of the groundwater’s natural denitrification potential.
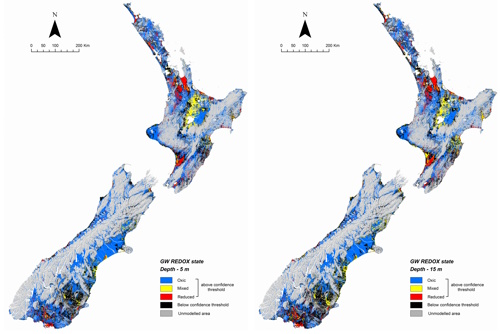
The new model uses information on variables such as soil, geology, and hydrology linked to wells where the redox state is known, to predict the redox state of groundwater in areas that don’t have existing data. The redox state indicates the denitrification potential.
Denitrification occurs under oxygen-depleted (or reduced) conditions when bacteria in the groundwater use the oxygen molecules in nitrate for their own respiration. Complete denitrification turns the nitrate into harmless nitrogen gas, which is released into the air. Nitrogen gas makes up 78% of the air around us.
The new model provides more confidence that its predictions are correct than previous models did.
The maps show the redox state of groundwater at 5, 15, 30, and 50 metres below the water table, and are accompanied by a map showing the depth to the water table throughout the country.
“The redox status of groundwater is a useful indicator for identifying potential denitrification zones, as an ecosystem service for tailored land management and targeted environmental regulations,” says Dr Theo Sarris of ESR.
The maps and datasets are available through this link (the site is compatible with desktops only).